Bookkeep Summary Report
The Bookkeep Summary Report is being replaced by Template Reconciliation, which shows the same journal entry amounts across all of your connections and templates at once, adds a balance check and missing-entry tracking, and exports a flat CSV. The Summary Report stays available for now, but new work goes into Template Reconciliation and this page will be removed when the Summary Report is switched off.
The Bookkeep Summary Report provides a consolidated summary of the journal entries Bookkeep posts to your accounting platform over a date range, with powerful filtering and export capabilities. You can analyze app-level financial activity by date range, report type, connection, and currency — and export the results for deeper analysis.
This makes it easy to answer questions like:
-
How did all of my Shopify stores perform in December?
-
What were total sales across all Square locations last month?
-
How do sales break down by product category across multiple stores?
-
Can I export this data for audit or reconciliation?
(Yes.)
App-Level Financial Reporting by Date Range
You can select a specific app, define a date range, and view all financial data for a chosen report type — such as Sales or Deposits — across:
-
A single connection, or
-
All connections for that app
Example use cases
-
View December sales across all 5 Shopify stores connected to Bookkeep
-
Filter to one Shopify store to review location-specific performance
-
Validate totals before posting or reconciling in your accounting system
Granular Rollups & Subcategory Visibility
Bookkeep goes beyond high-level totals by allowing granular views of your financial data, based on your selected rollup method.
If your sales are rolled up by product category, you can:
-
See gross sales broken down by category
-
Drill into subcategory-level detail
-
Understand what’s driving revenue across stores or locations
This gives you both:
-
Summary-level insight for accounting, and
-
Detailed operational visibility when you need it
Export Your Financial Data
All reported data can be exported, making it easy to:
-
Share reports with stakeholders
-
Support audits or reviews
-
Perform custom analysis outside of Bookkeep
-
Tie totals back to your accounting platform
Exports respect:
-
App selection
-
Date range
-
Report type
-
Connection filters
-
Currency selection
What you see is exactly what you can export.
How It Works
1. Open the Bookkeep Summary Report
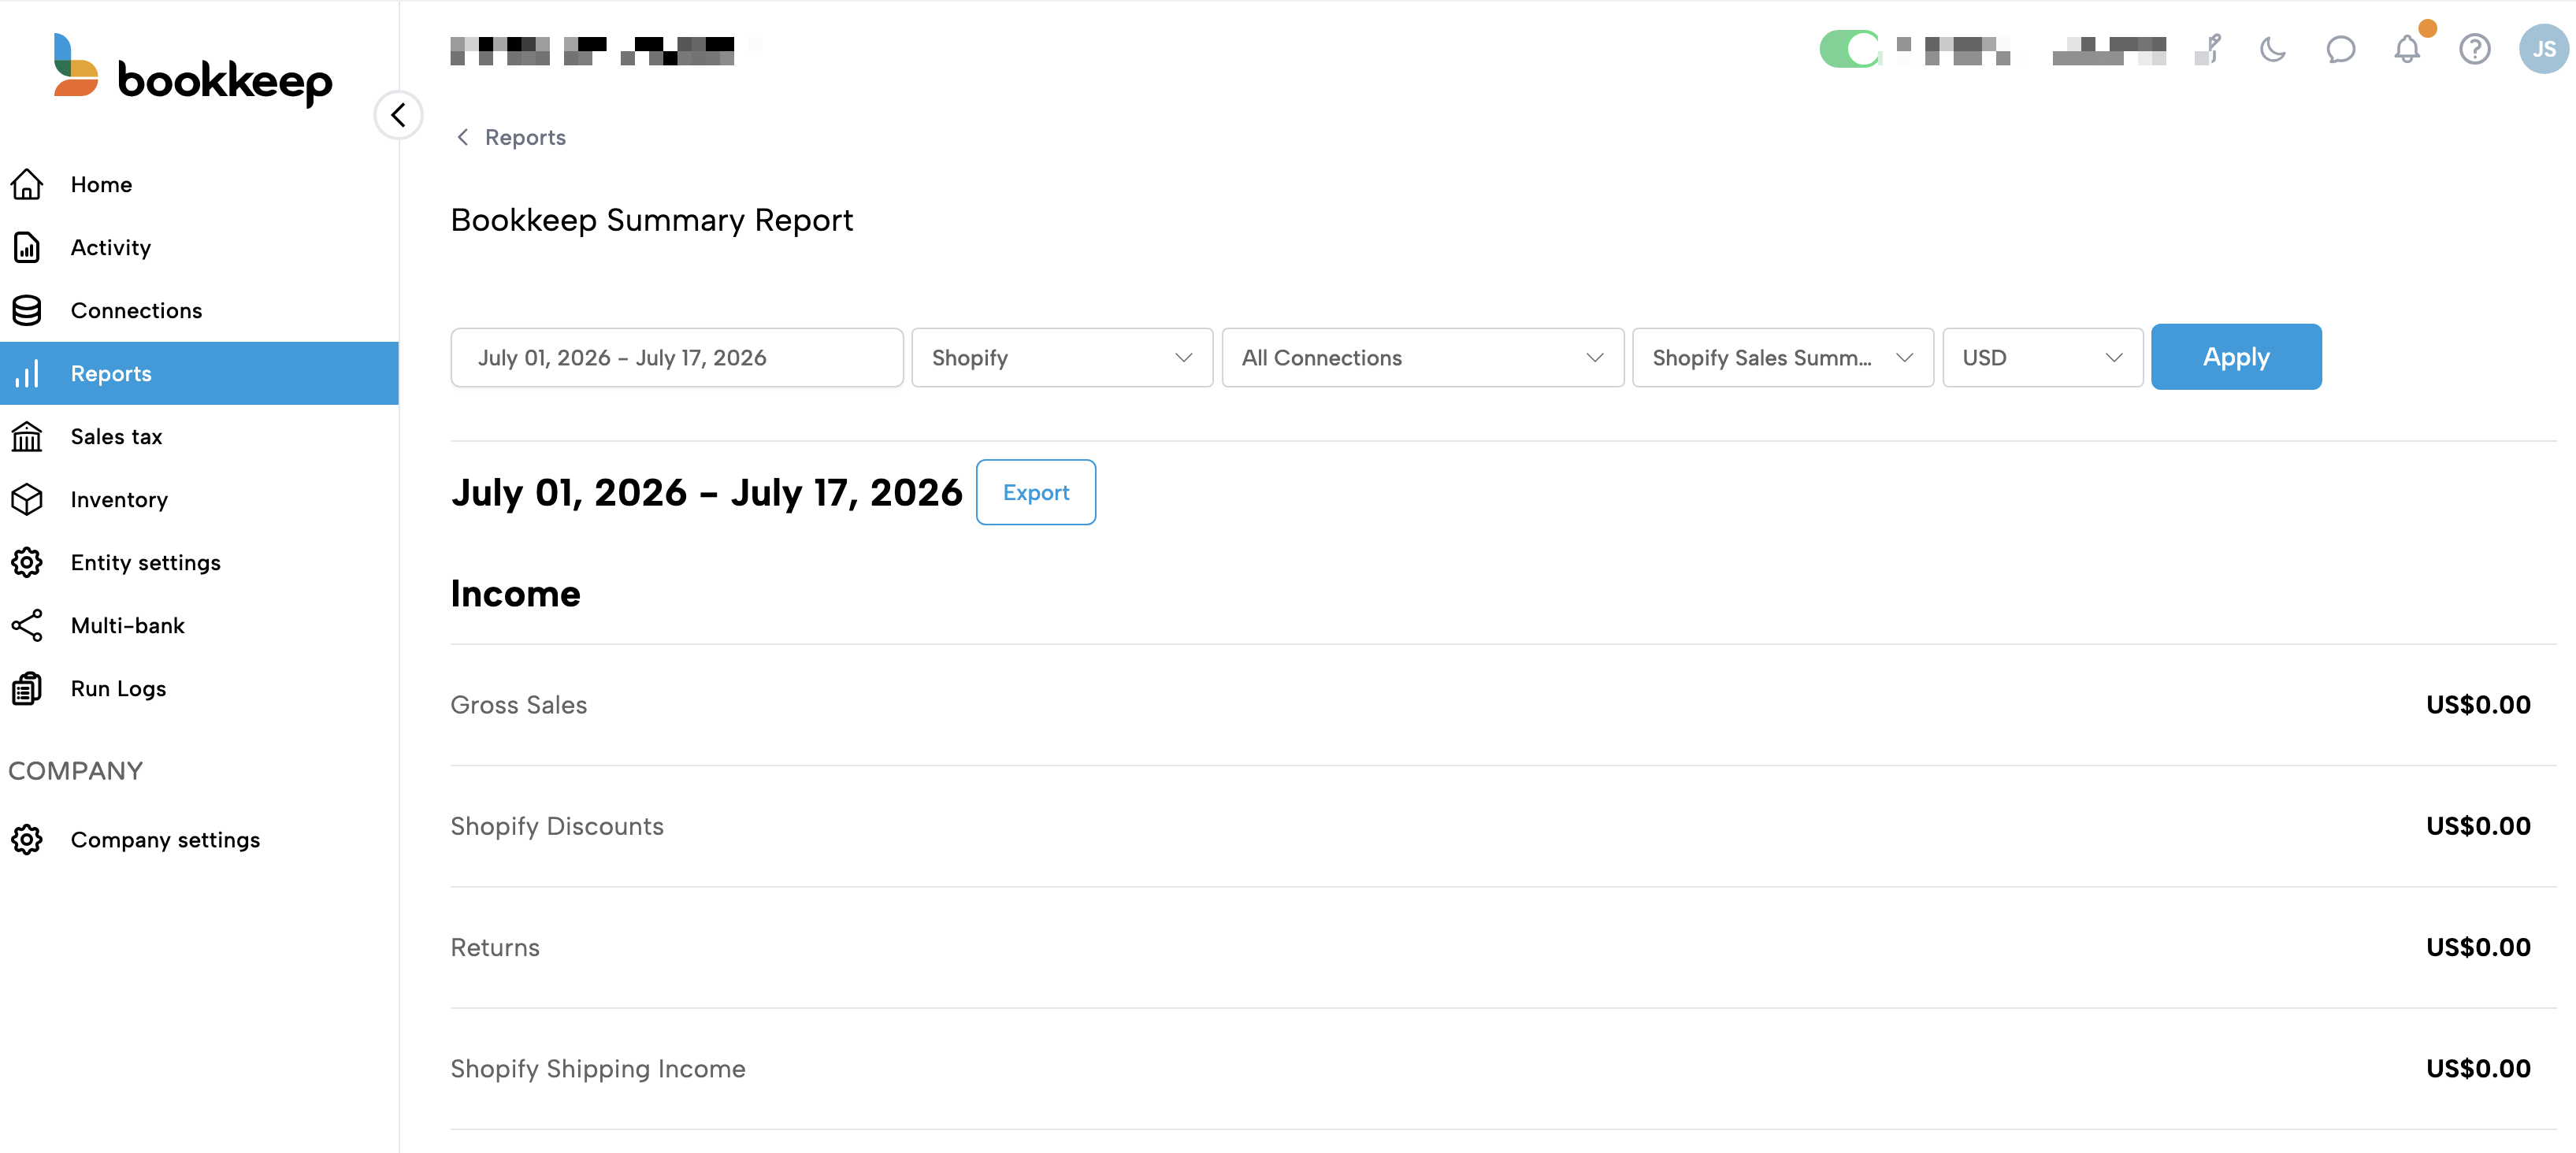
Click Reports in the left navigation menu. This opens the Reports page, which lists all reports available to your entity. Under the Bookkeep section, click Bookkeep Summary Report.
2. Set a Date Range
Use the date range picker to define the time period you want to analyze. Bookkeep returns all matching financial data across the selected connections.
3. Select an App and Connections
Choose the app you want to analyze (e.g., Shopify, Square, Stripe).
By default, Bookkeep includes all connections for that app, with the option to filter to a subset of connections in the "All Connections" dropdown.
4. Choose a Report Type
Select the financial activity you want to review, such as:
-
Sales
-
Deposits
-
Other app-specific report types
5. Select a Currency
Because Bookkeep supports multi-currency environments, you must select a single currency to view or export data.
This ensures totals remain accurate and comparable.
6. Generate Your Report
After selecting the desired dates, app, connections, report type, and currency, click the Apply button to instantly view the financial results for the selected date range.
7. Export Your Data
After clicking "Apply," you will see an Export button next to the date range title, as shown in the screenshot above.
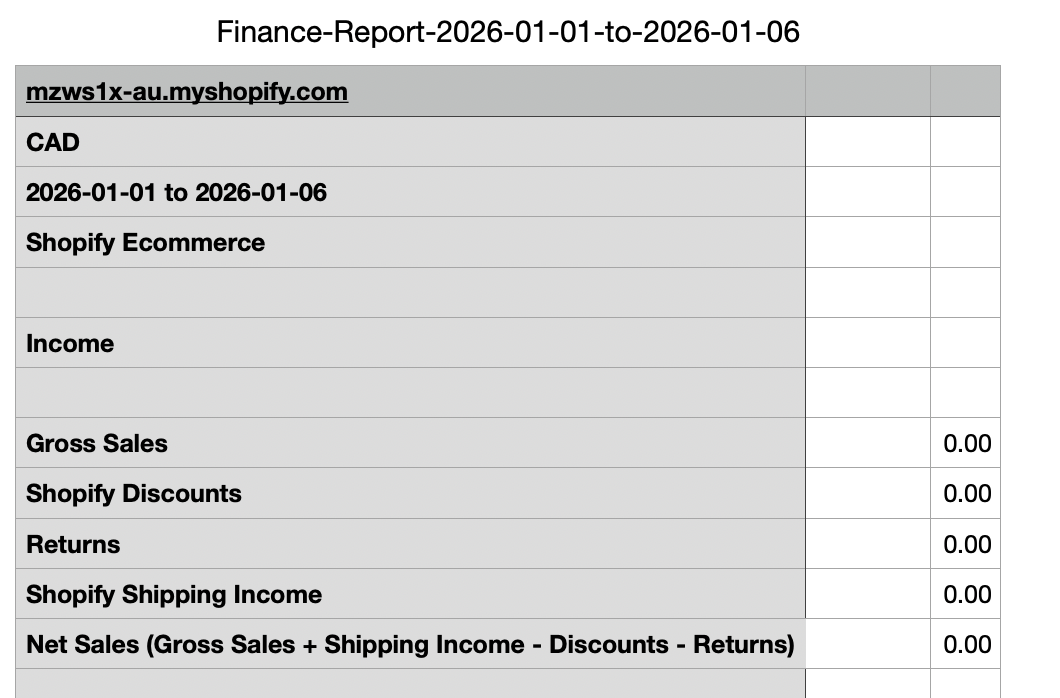
Clicking "Export" will download the data as a CSV on your device.
Why This Matters
The Bookkeep Summary Report helps you:
-
See all financial activity in one place
-
Analyze performance across multiple stores or locations
-
Drill into detailed revenue drivers when needed
-
Export clean, accounting-ready data
-
Simplify month-end, reconciliation, and audits
In short, it gives you full visibility and control over your financial data — from high-level summaries down to category-level detail.
If you have any questions or need assistance, please don't hesitate to contact our support team at support@bookkeep.com.